The Church Metrics Dashboard
That Replaces Spreadsheets
Vitals replaces spreadsheets with clear, contextual data and AI-powered insights, giving pastors and leaders the clarity they need to make confident decisions.
Still using spreadsheets for church metrics?
Spreadsheets lose context, don't show trends over time, and make it impossible to compare against last year. Your ChMS gives you raw data, but Vitals gives you understanding.
Everything tracked. Nothing missed.
Powerful enough for techies, simple enough for volunteers.
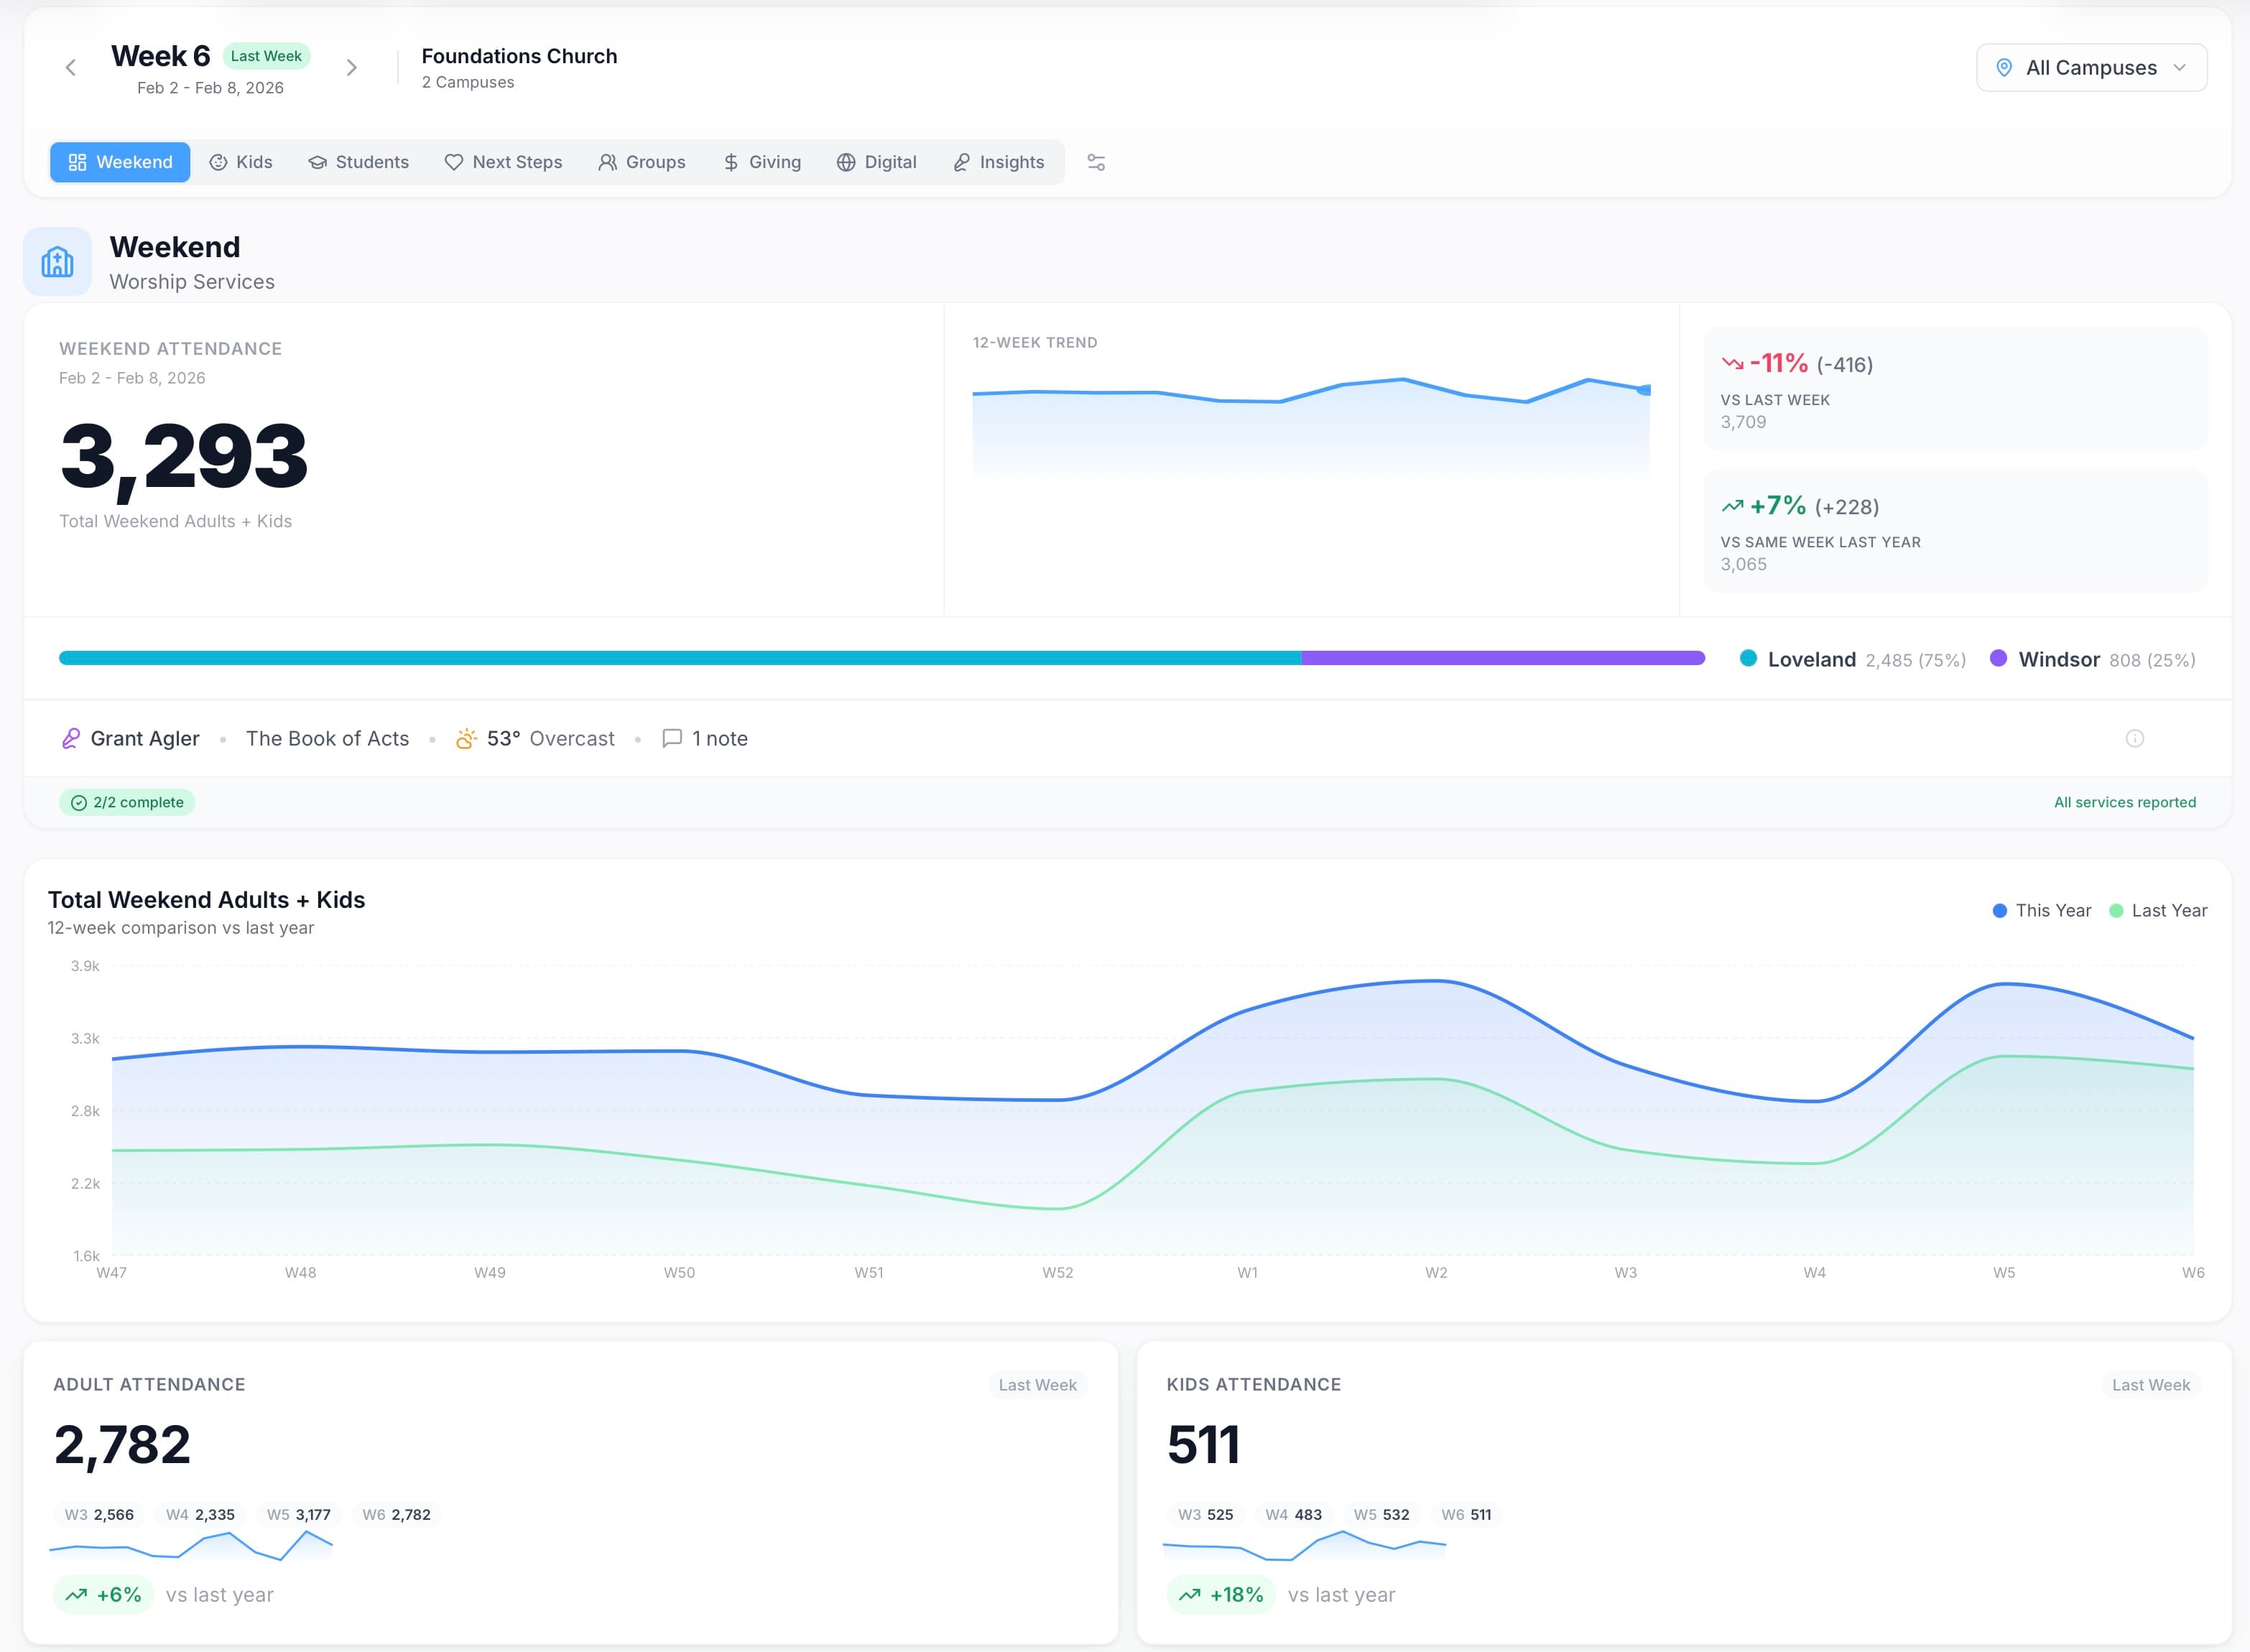
Contextual Attendance
Numbers without context are just noise. Vitals automatically pulls weather data, speaker info, and notes—all displayed alongside your attendance, so you know why trends are happening.
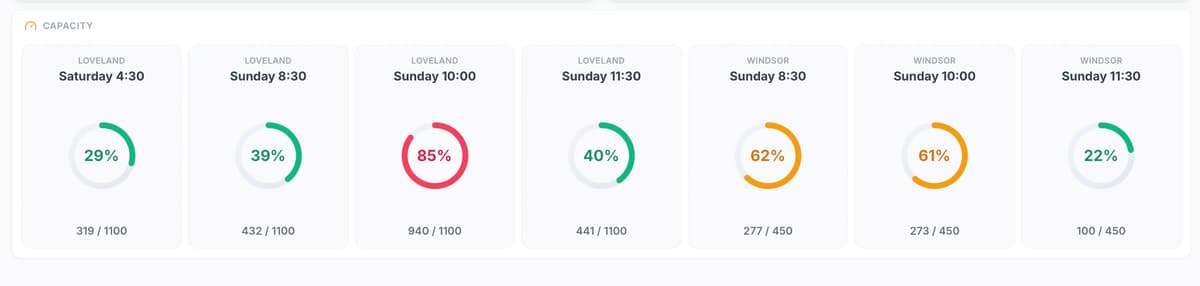
Capacity Gauges
Hit the 80% rule? See room capacity across all services instantly.
Smart Import
Sync with PCO or use our smart CSV importer. Your data is never hostage.
AI Headcount
Snap a photo of the auditorium. Our AI counts the people for you.
Unlimited Staff
Grant granular access to pastors, staff, and volunteers at no extra cost.
Multi-Campus
Full manual entry or sync with a ChMS. Support for multiple locations built-in.
Event Tracking
Track Christmas, Easter, and yearly events. Pull up historical trends instantly.
Speaker Analytics
Track attendance and engagement by speaker. See what resonates.
AI Insights
Every dashboard gets AI-powered insights that explain your trends.
Every Ministry Gets Its Own Dashboard
No more digging through data. Each ministry sees exactly what matters to them.
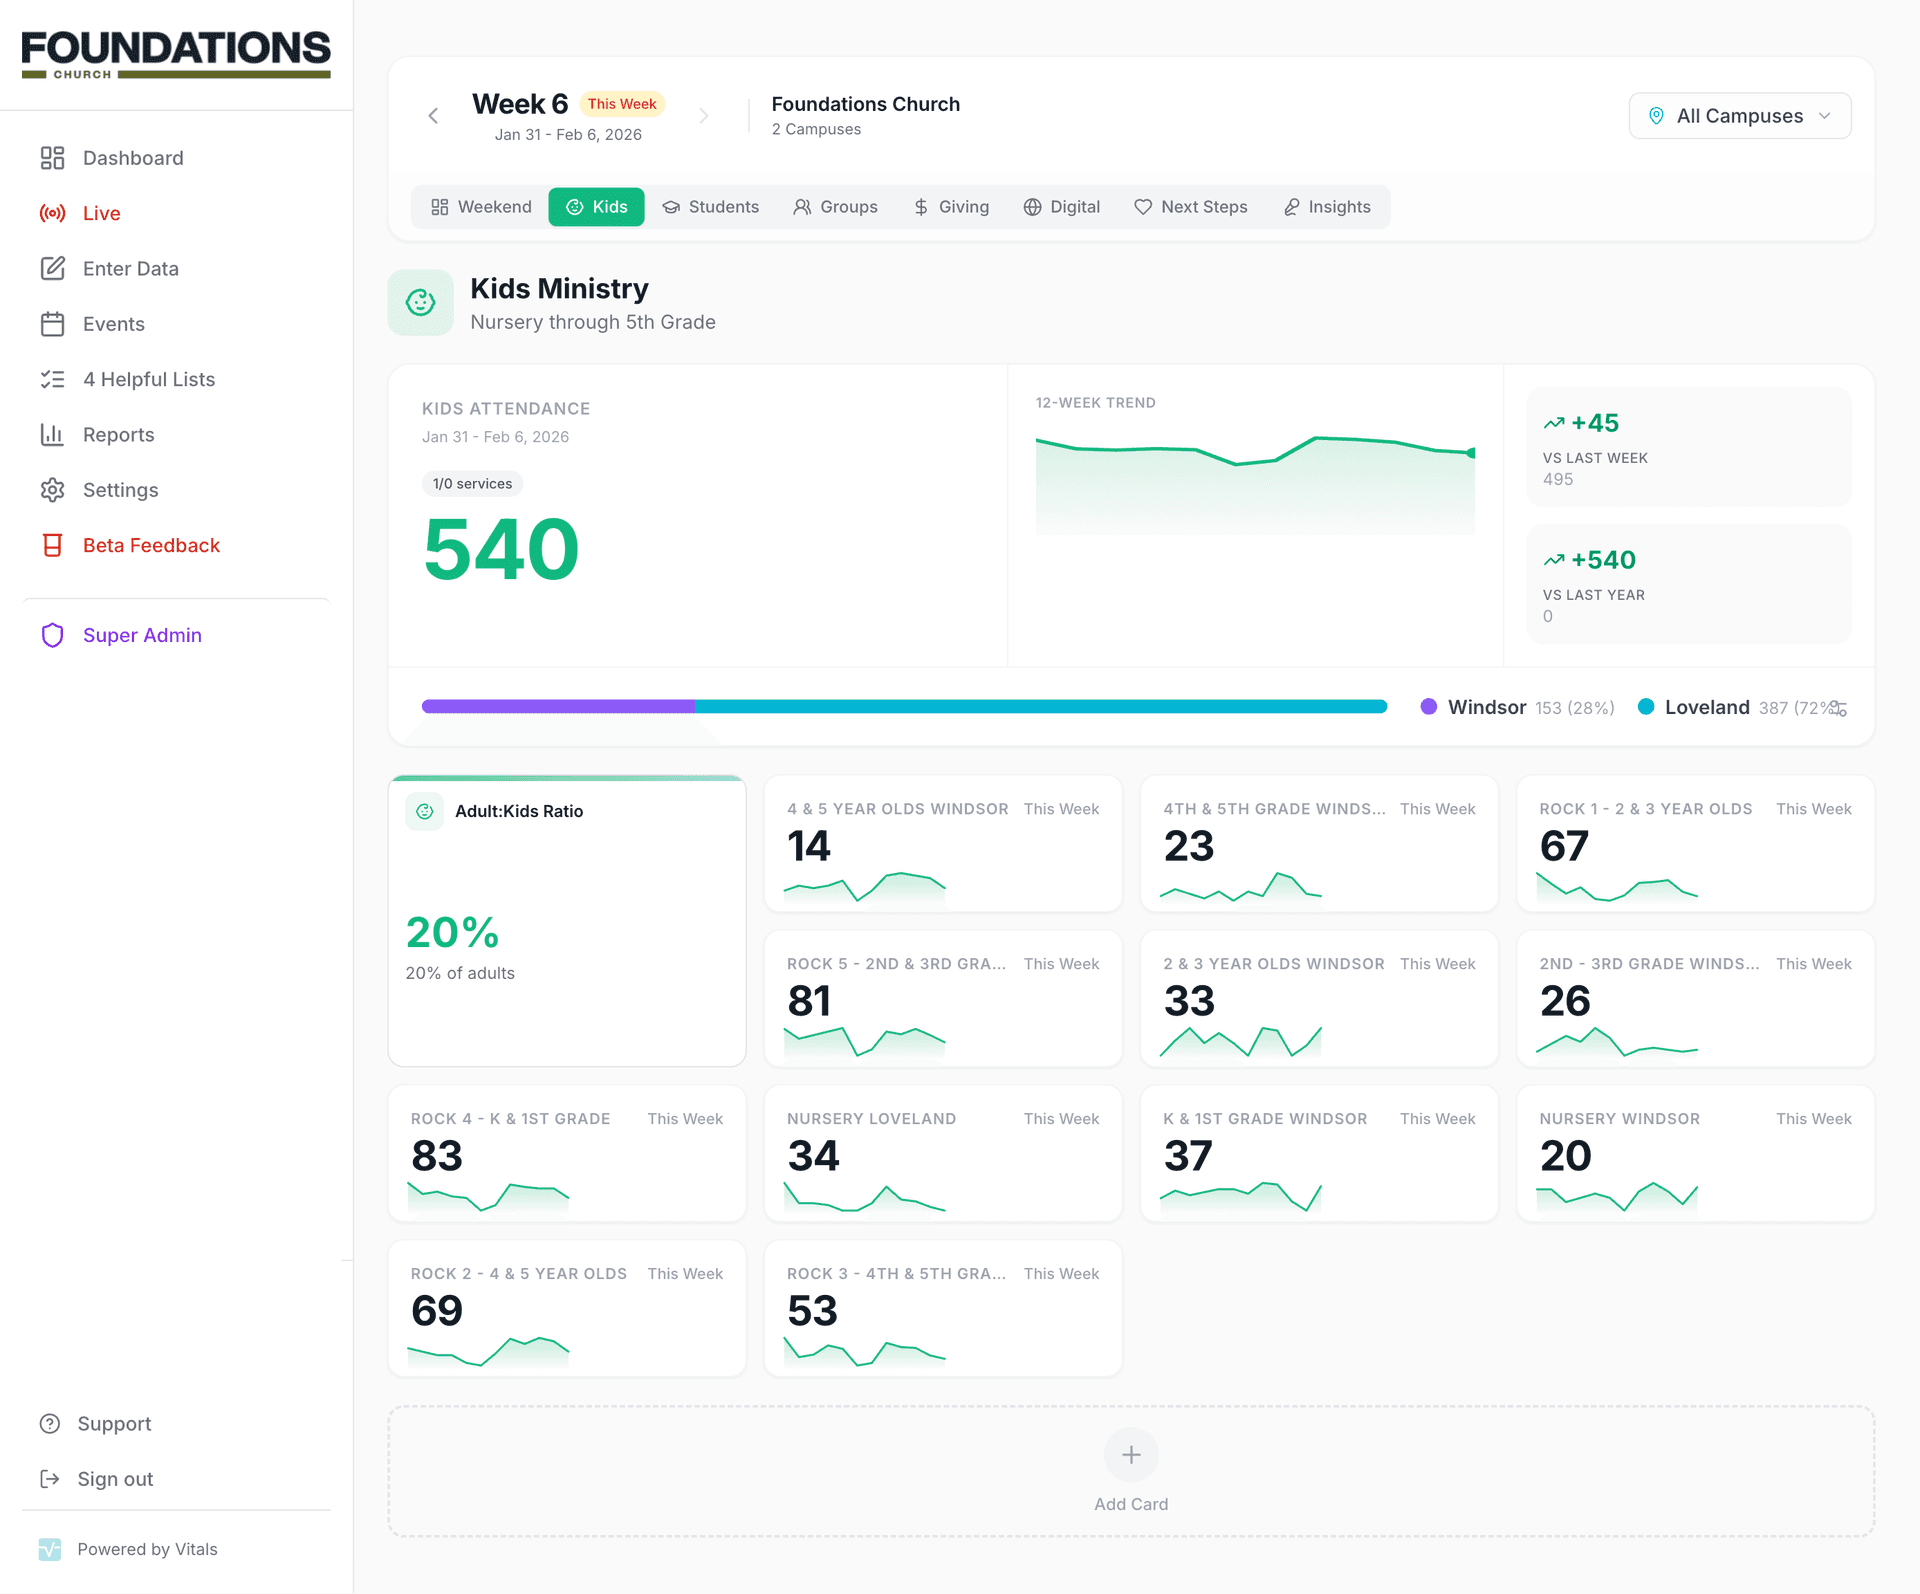
Kids Ministry
Track nursery through elementary with detailed breakdowns by age group, room capacity, and adult-to-child ratios for safety compliance.
- Real-time adult-to-child ratio tracking
- Breakdown by room and age group
- Multi-campus comparison
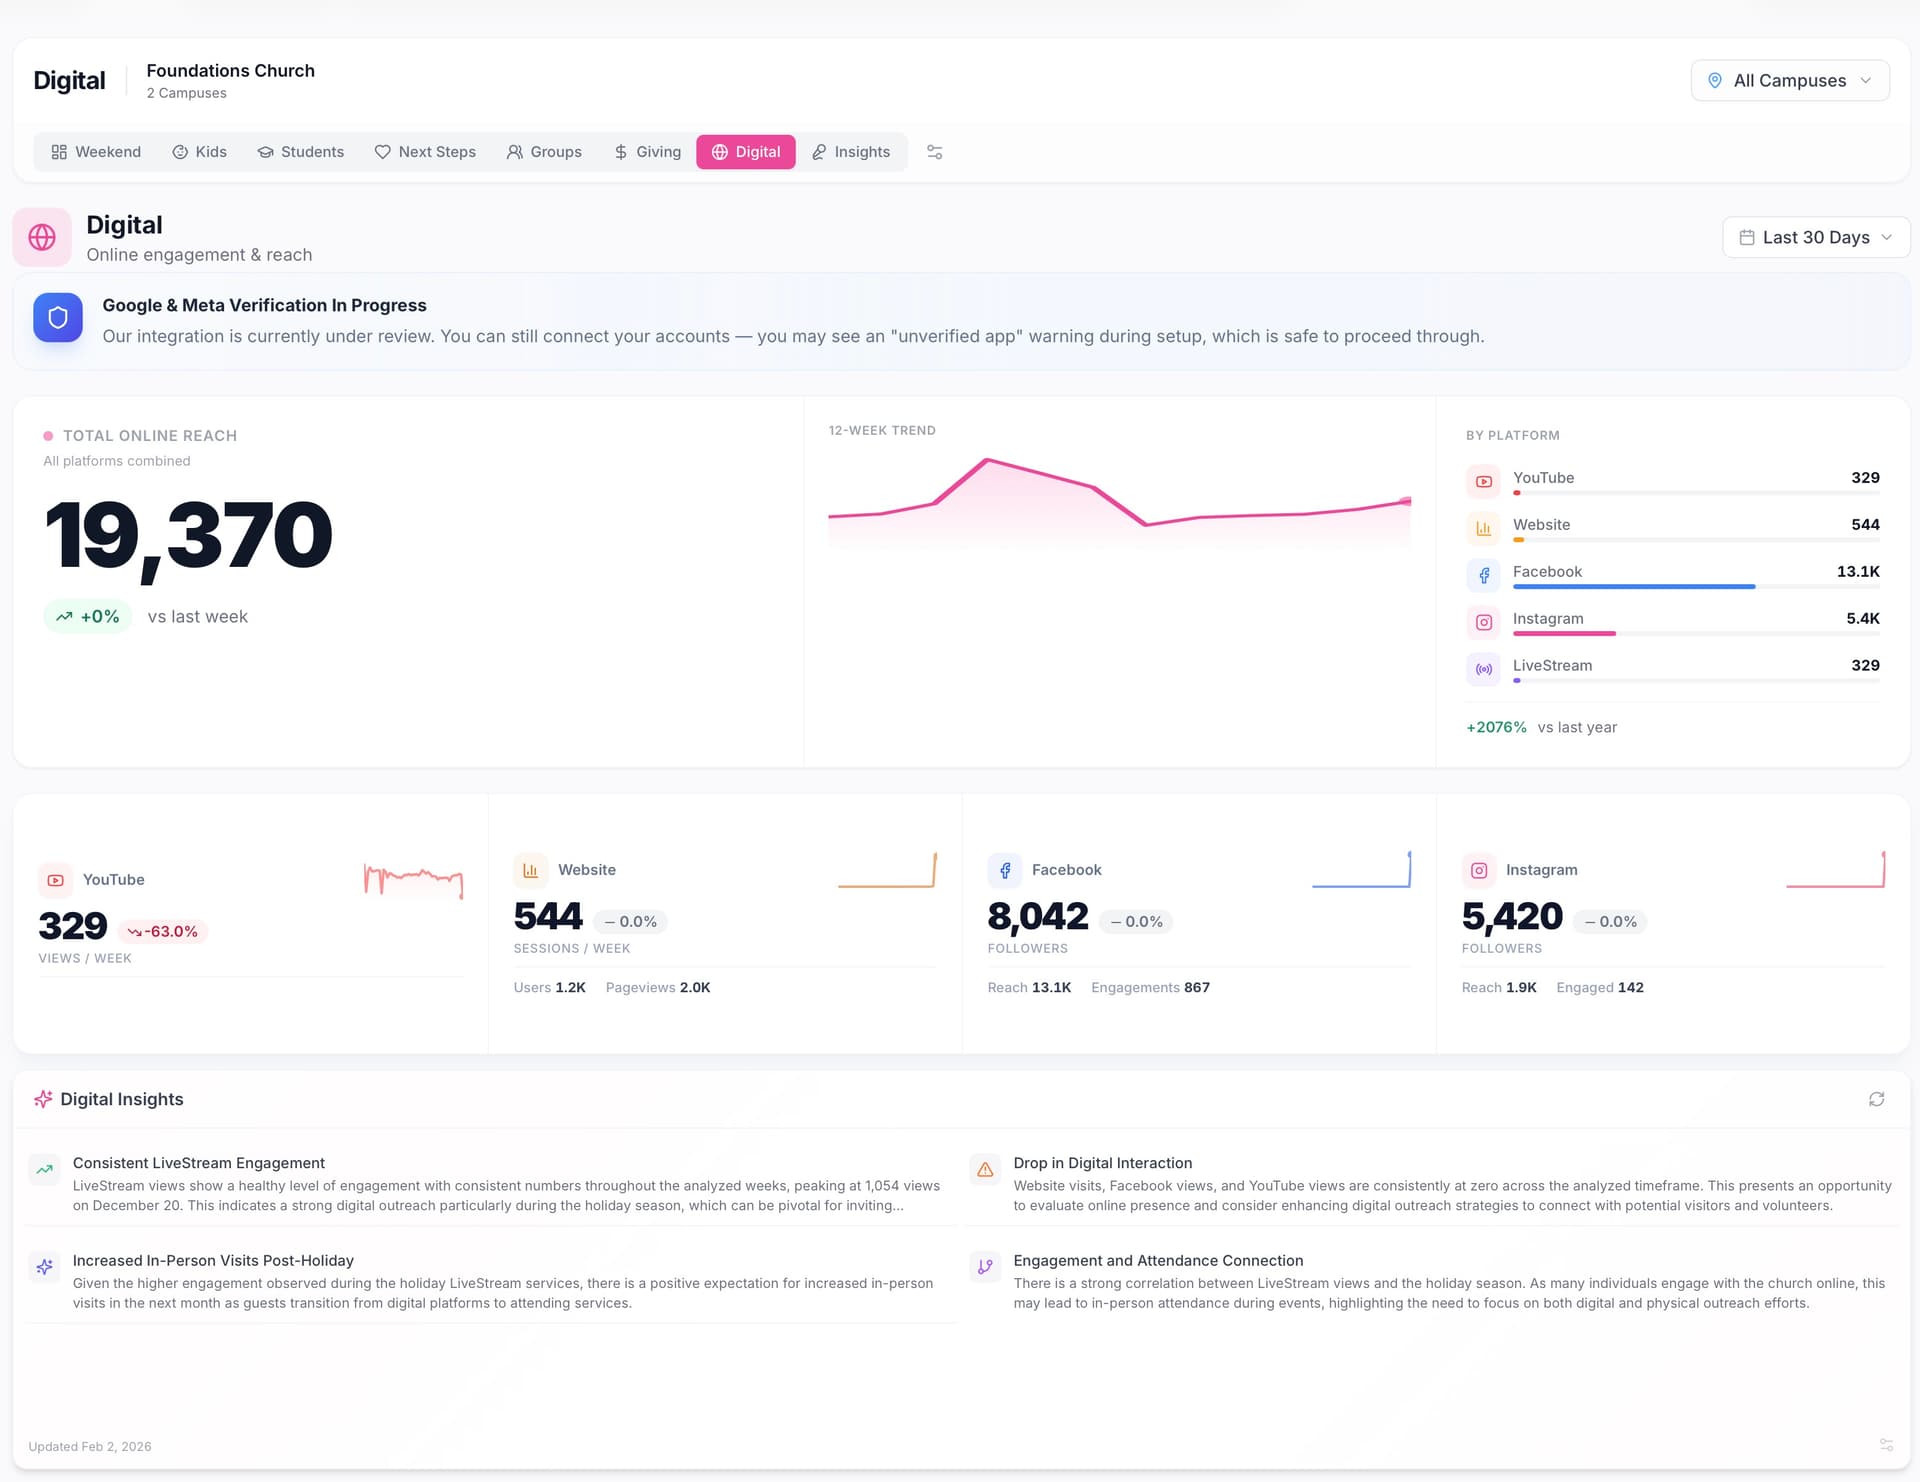
Digital Ministry
See your online reach across all platforms. YouTube, Facebook, website traffic, and livestream engagement—all in one place.
- Livestream viewer analytics
- Platform-by-platform breakdown
- AI-powered engagement insights
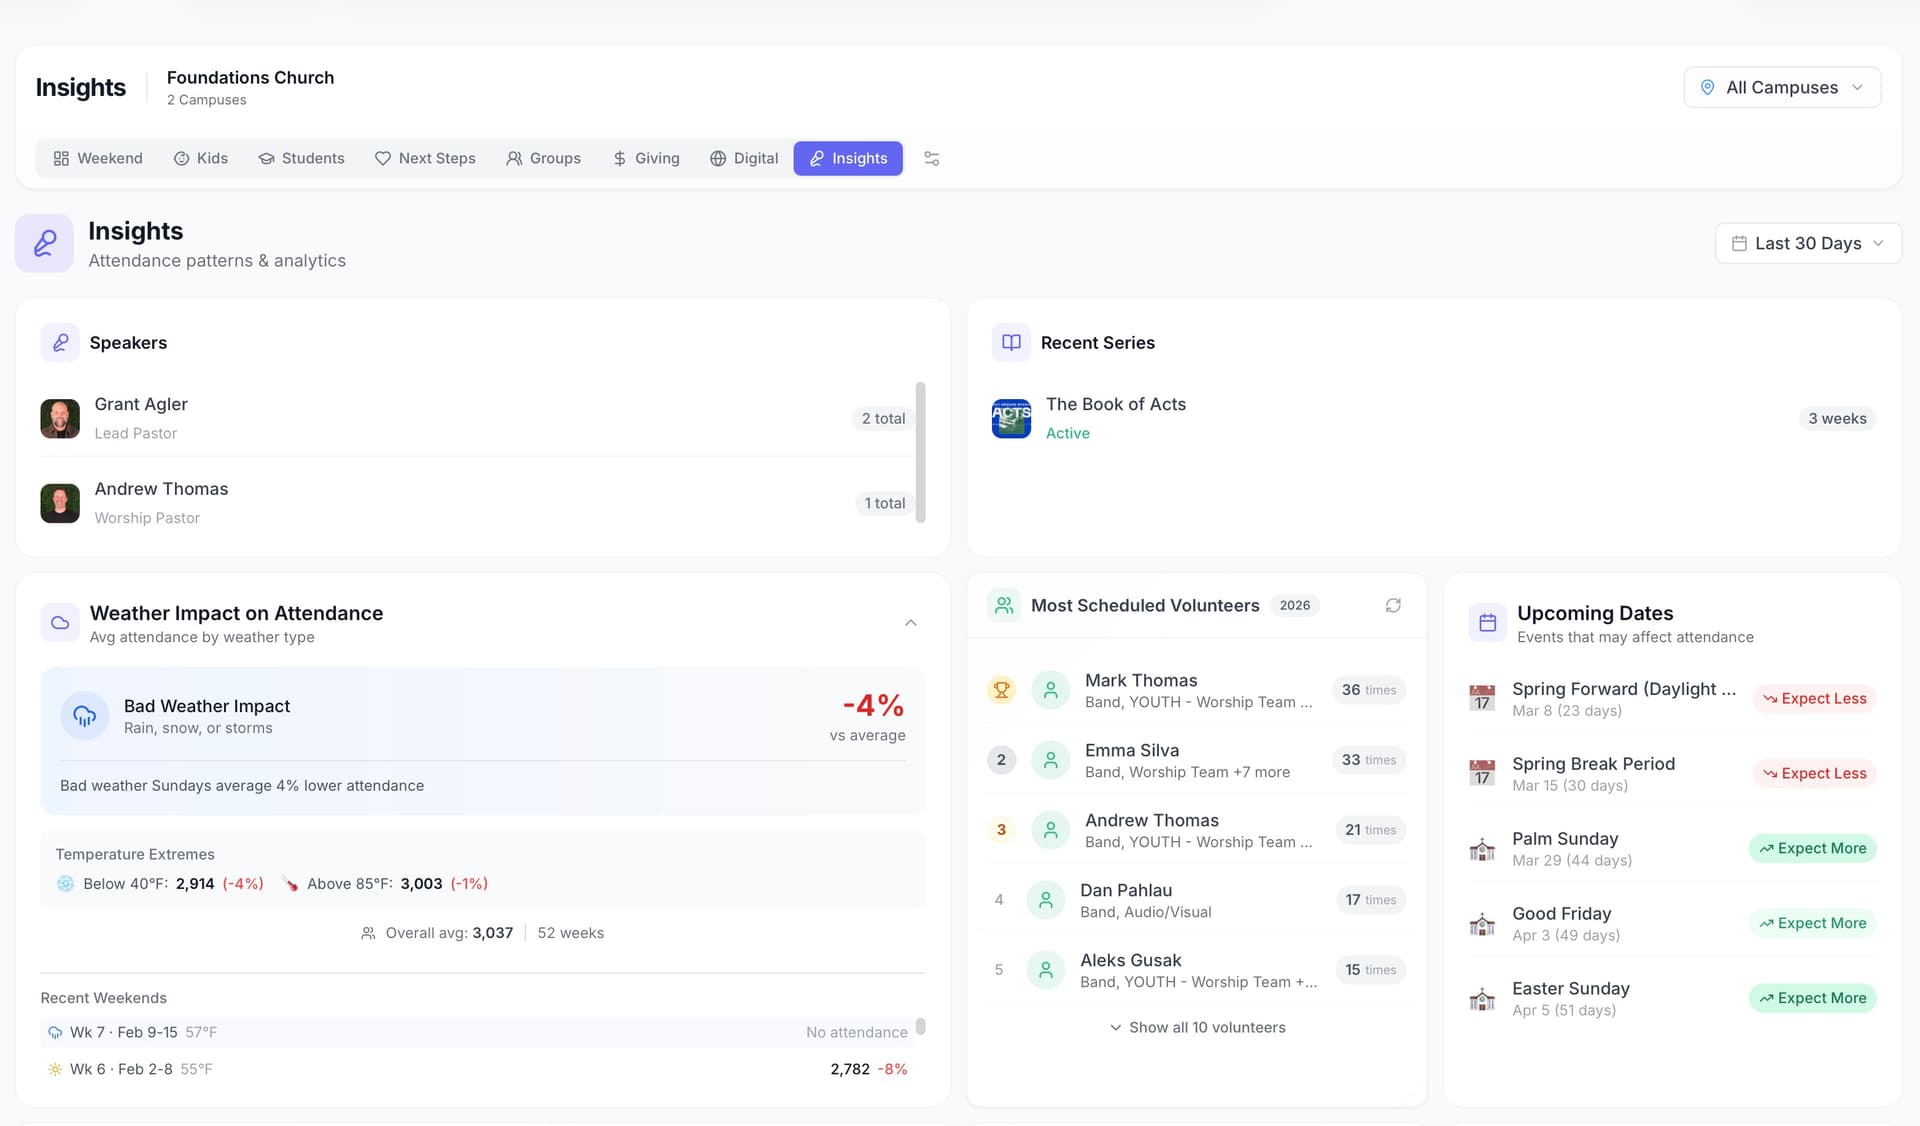
AI-Powered Insights
Let AI surface what matters. See speaker history, upcoming holidays, weather impact on attendance, and data health alerts—all automatically.
- Speaker & series performance tracking
- Weather impact on attendance analysis
- Holiday & event planning alerts
- Data health monitoring
Go Beyond the Numbers
Health dashboards surface what raw totals can't — burnout risk, donor concentration, group engagement, and more.
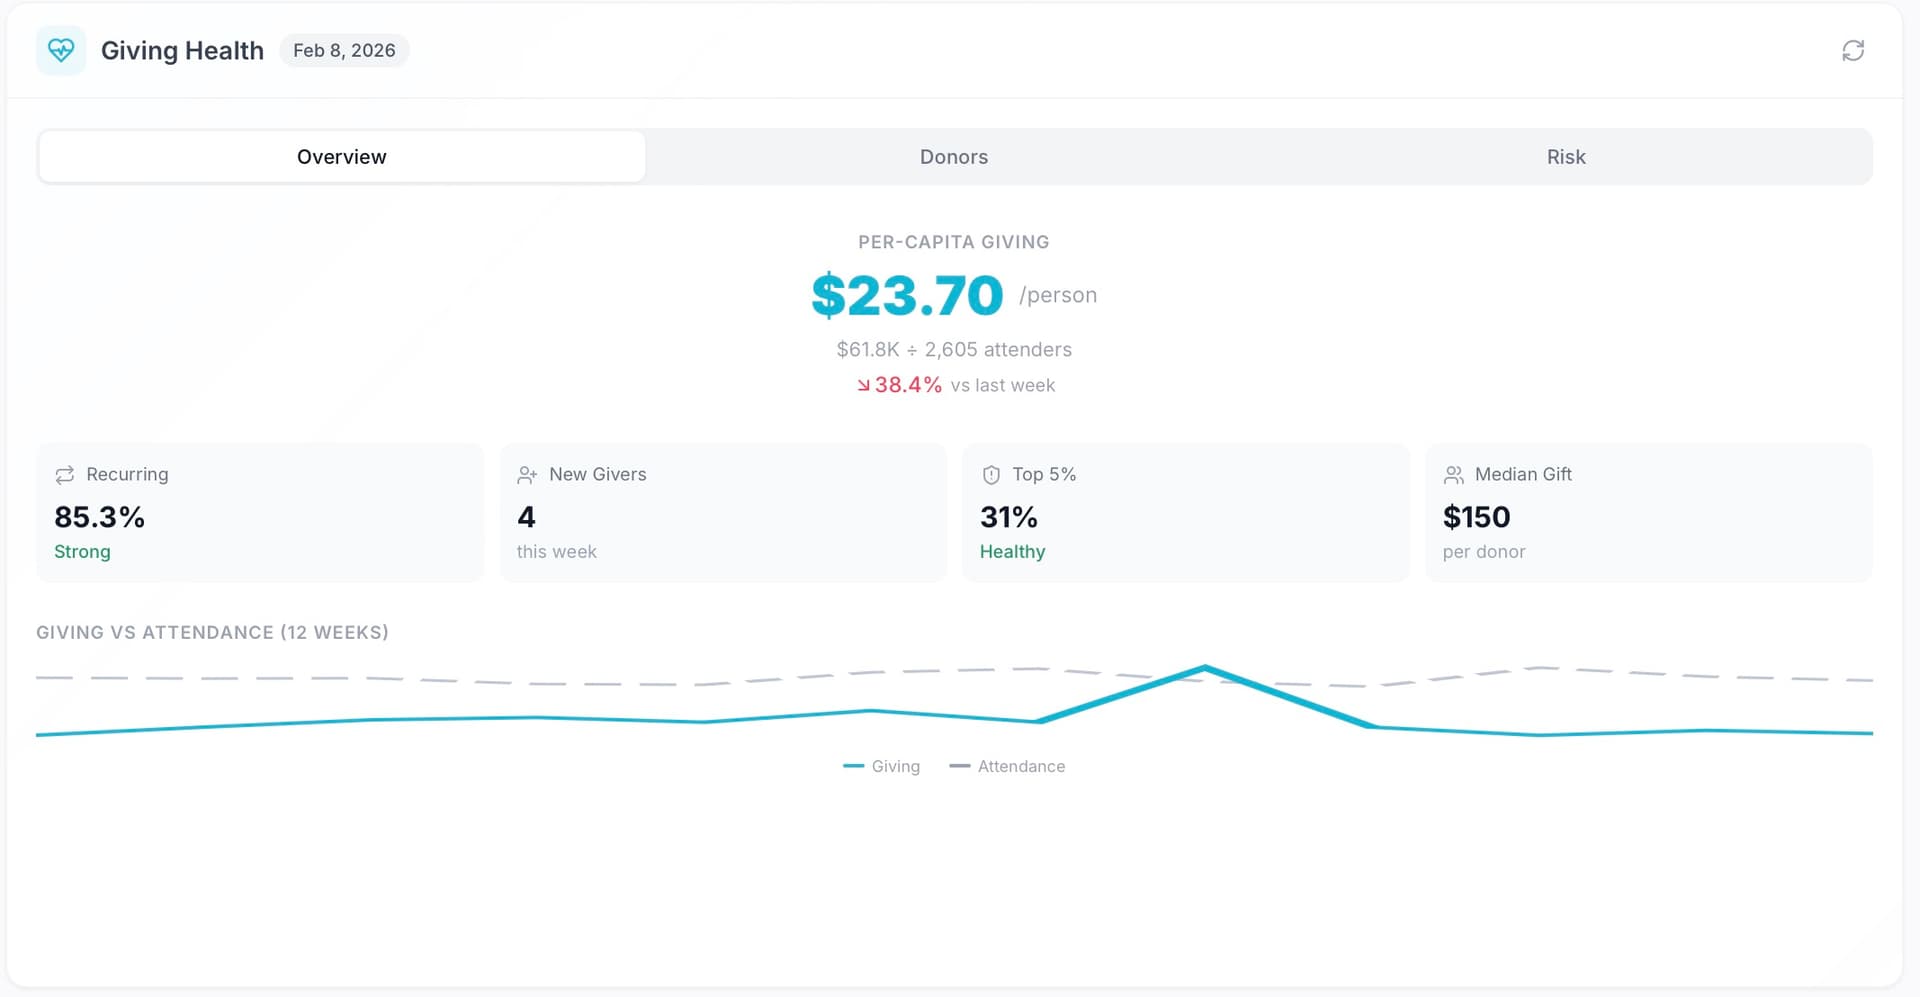
Giving Health
Track per-capita giving, donor segments, and giving concentration so you know how healthy your generosity culture really is.
- Per-capita giving with attendance context
- Donor segments: recurring, occasional, first-time, lapsed
- Giving concentration risk analysis
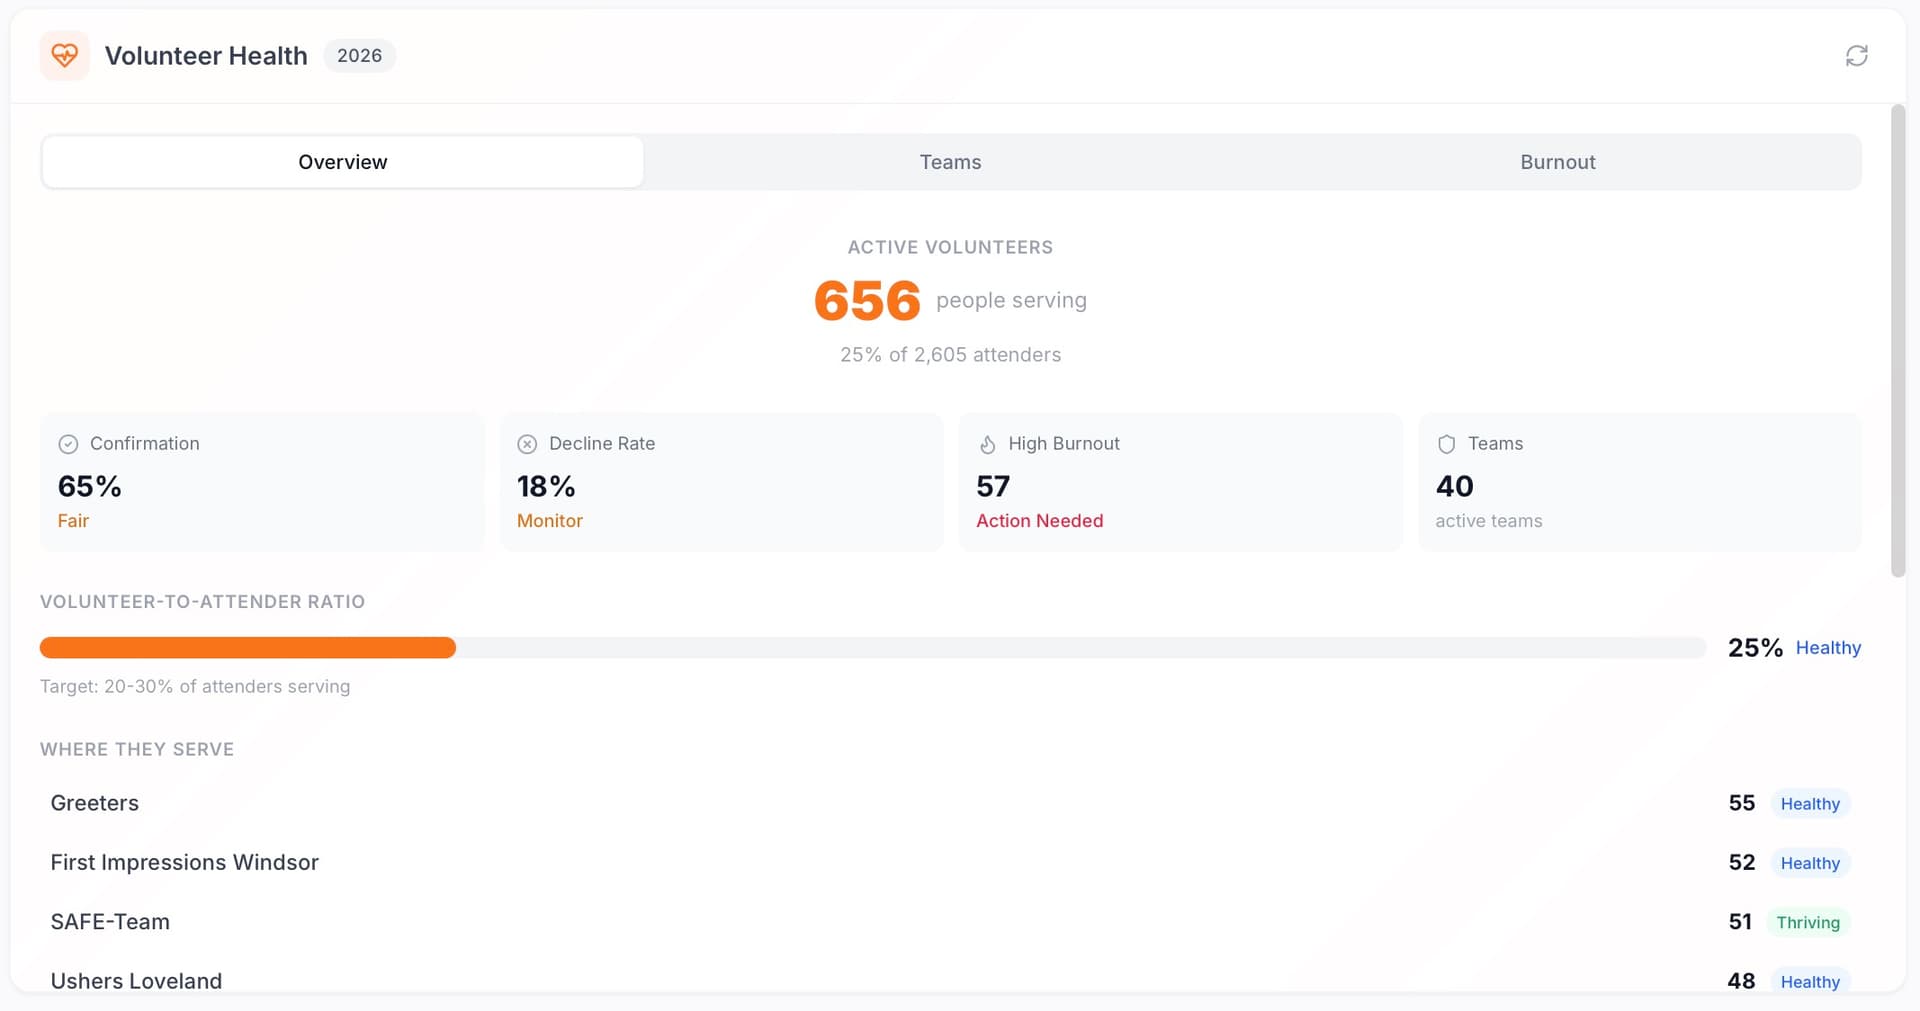
Volunteer Health
Know exactly who's serving, who's burning out, and where your volunteer gaps are — before they become a crisis.
- Volunteer-to-attender ratio tracking
- Burnout detection and confirmation rates
- Team-by-team breakdown with health scores
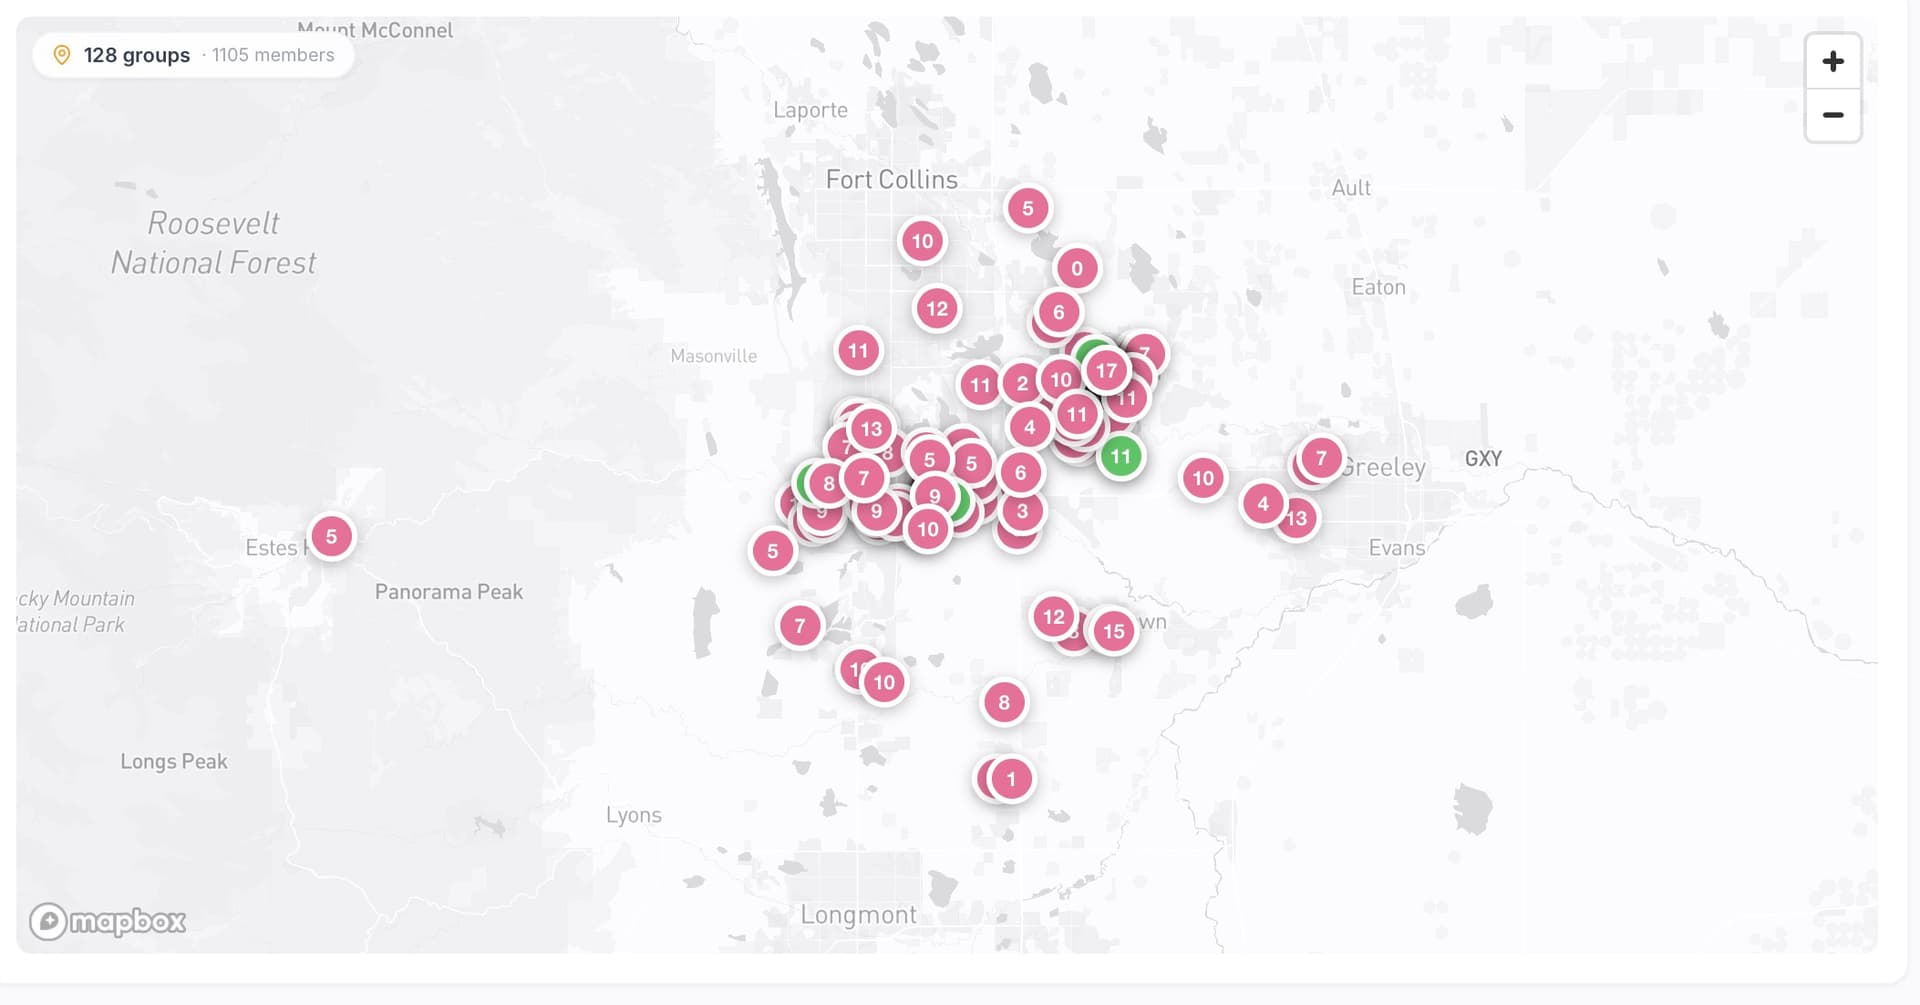
Groups Map
Visualize where your small groups meet across your city. Spot coverage gaps and plan new groups where they're needed most.
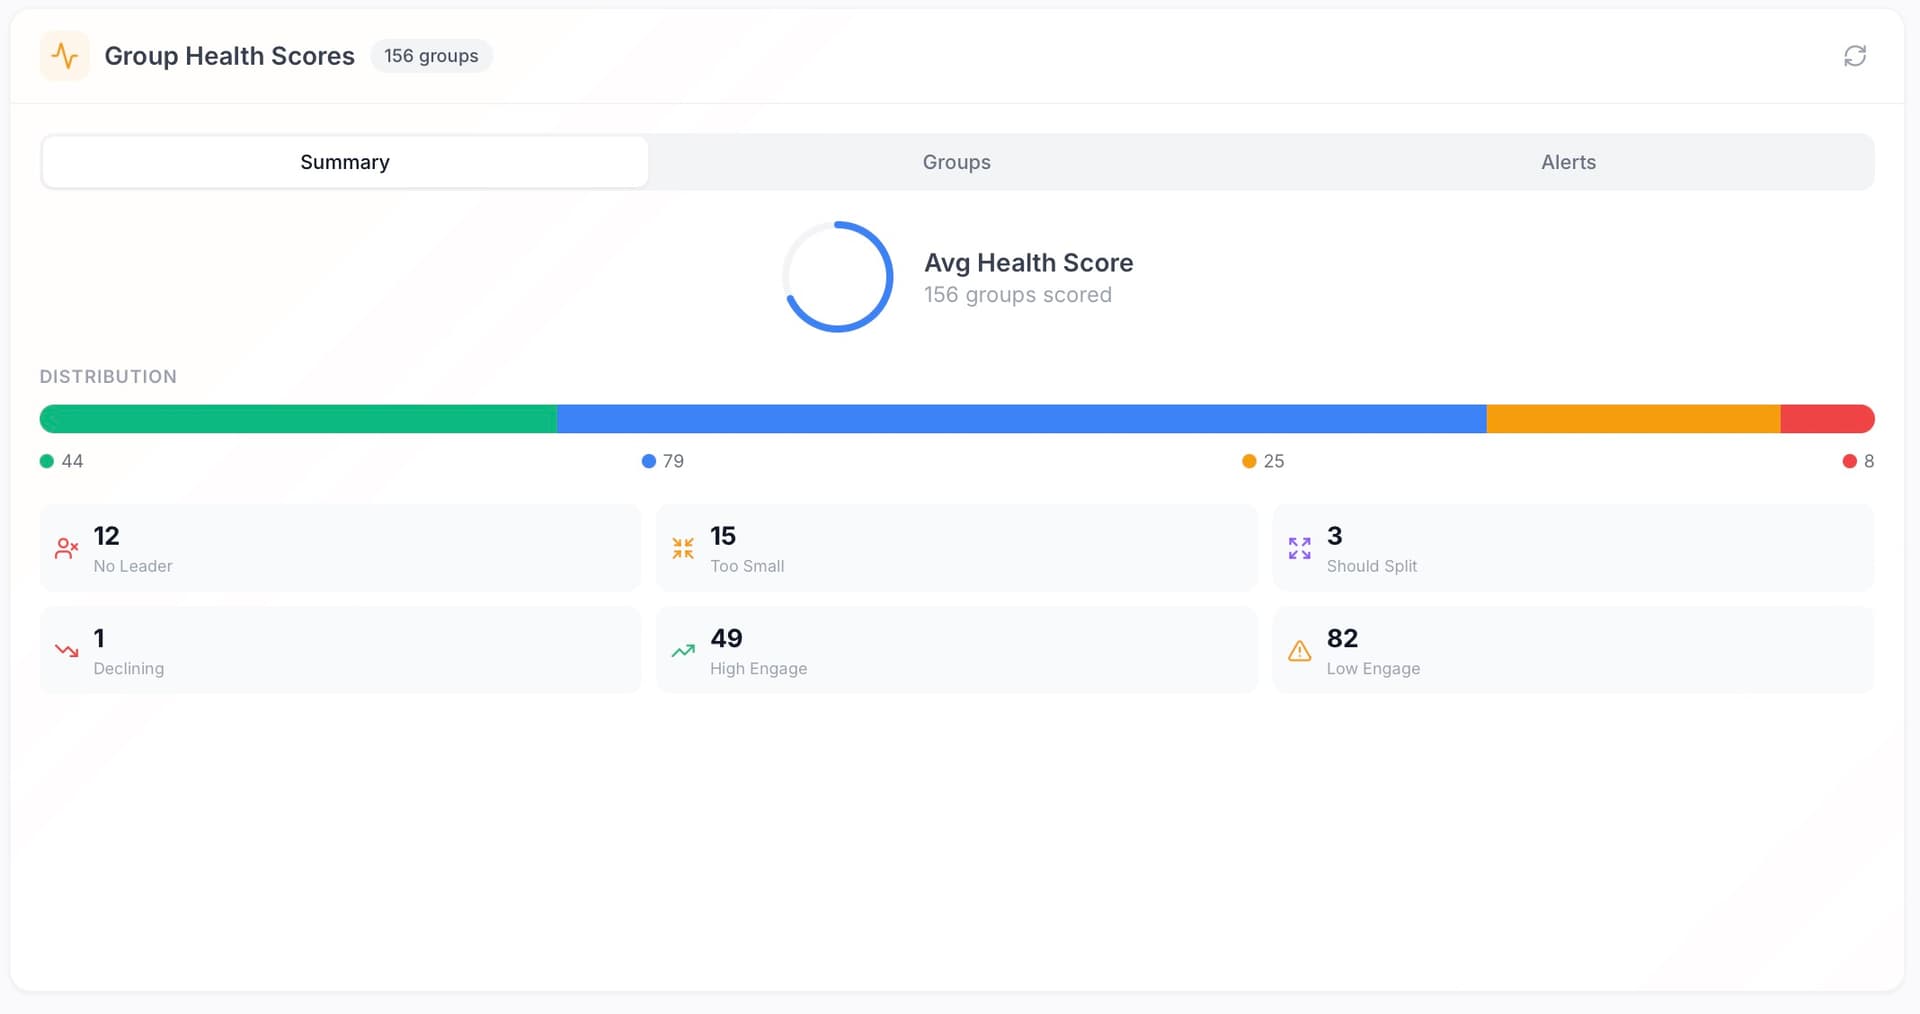
Group Health Scores
Every group gets a health score based on attendance, engagement, and leader status. See which groups need attention at a glance.
Track from anywhere with the mobile app
Enter attendance, view real-time numbers, and get instant service capacity updates—all from your phone.
- AI Photo Counting
Snap a photo of any section and let AI count the people for you. Game-changing for large services.
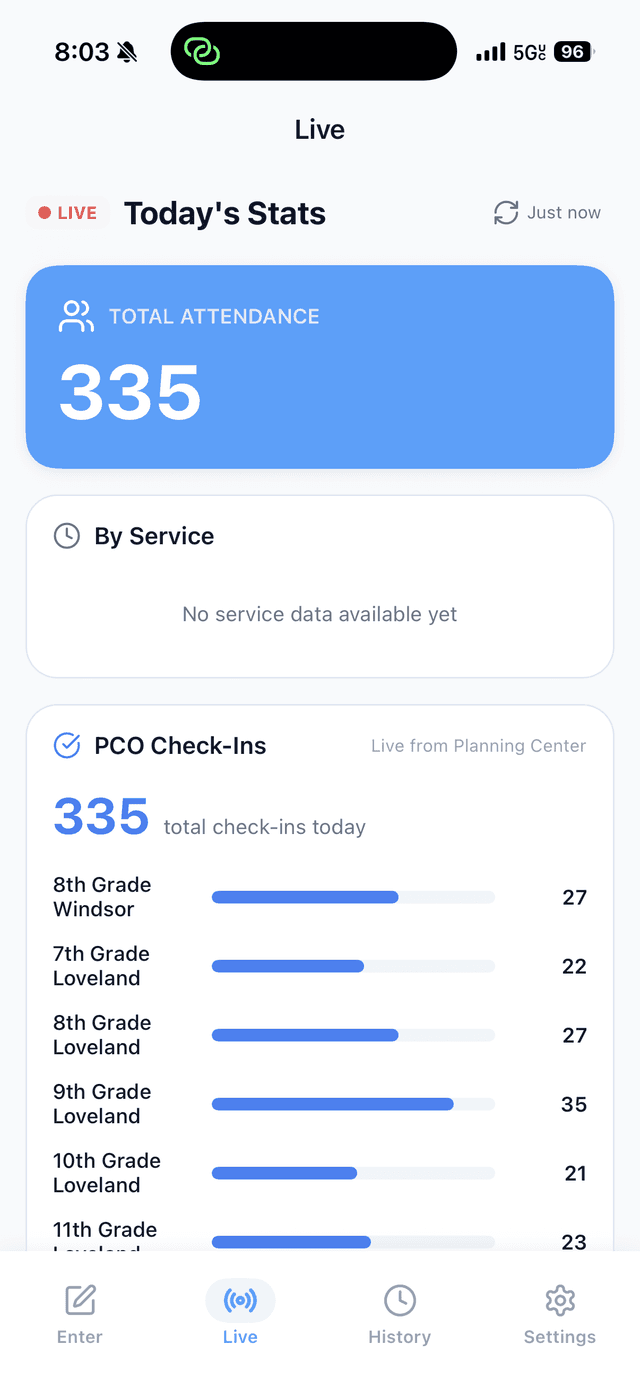
- Real-Time Dashboard
See how busy services are instantly. Perfect for making quick decisions during weekends.
- Assigned Metrics
Volunteers only see what they need. Simple data entry for non-techie helpers.
Debrief Every Weekend.
Improve Every Week.
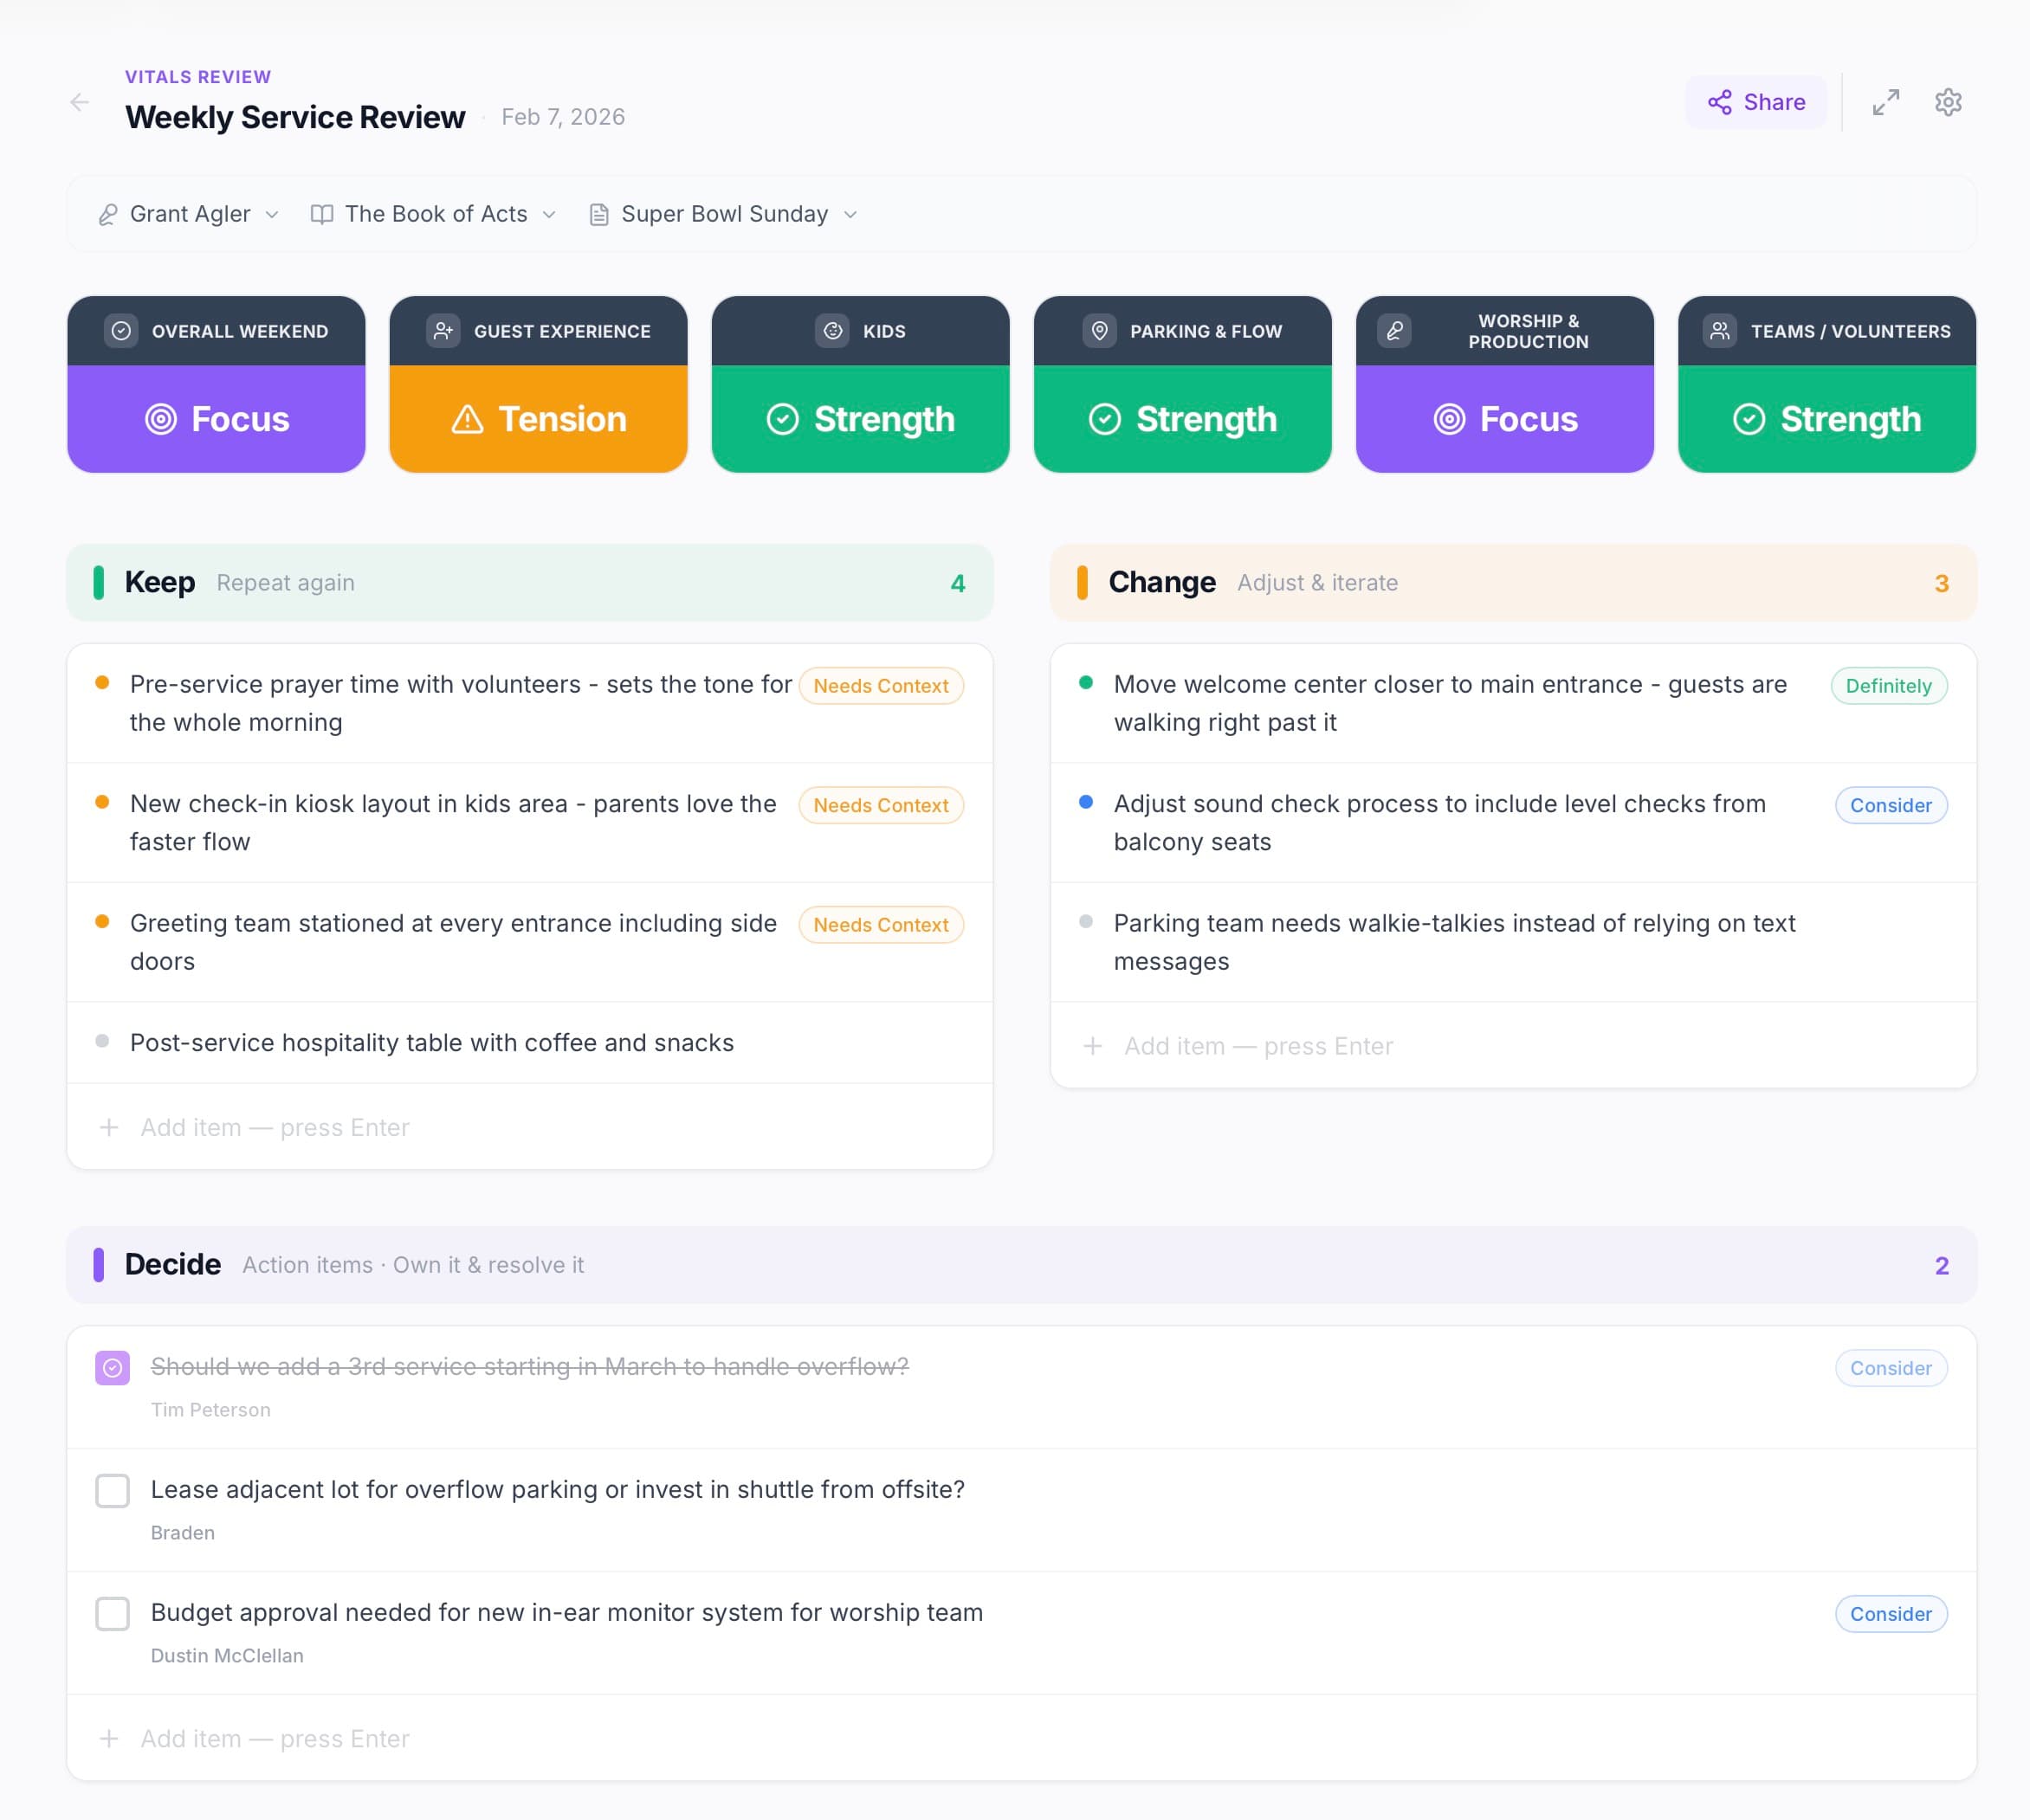
Turn your weekend debrief into an actionable system. Rate each ministry area, capture what to keep doing, what to change, and decisions that need to be made—all in one place.
- Category Scorecards — Rate guest experience, kids, worship, parking & more as Focus, Strength, or Tension
- Keep · Change · Decide — Structured columns so nothing falls through the cracks after each service
- Share with Your Team — One-click sharing so every leader sees what happened and what's next
Weekly Reports.
Delivered Automatically.
Keep your entire leadership team in the loop without lifting a finger. Vitals sends beautiful, data-rich reports straight to email and Slack every week.
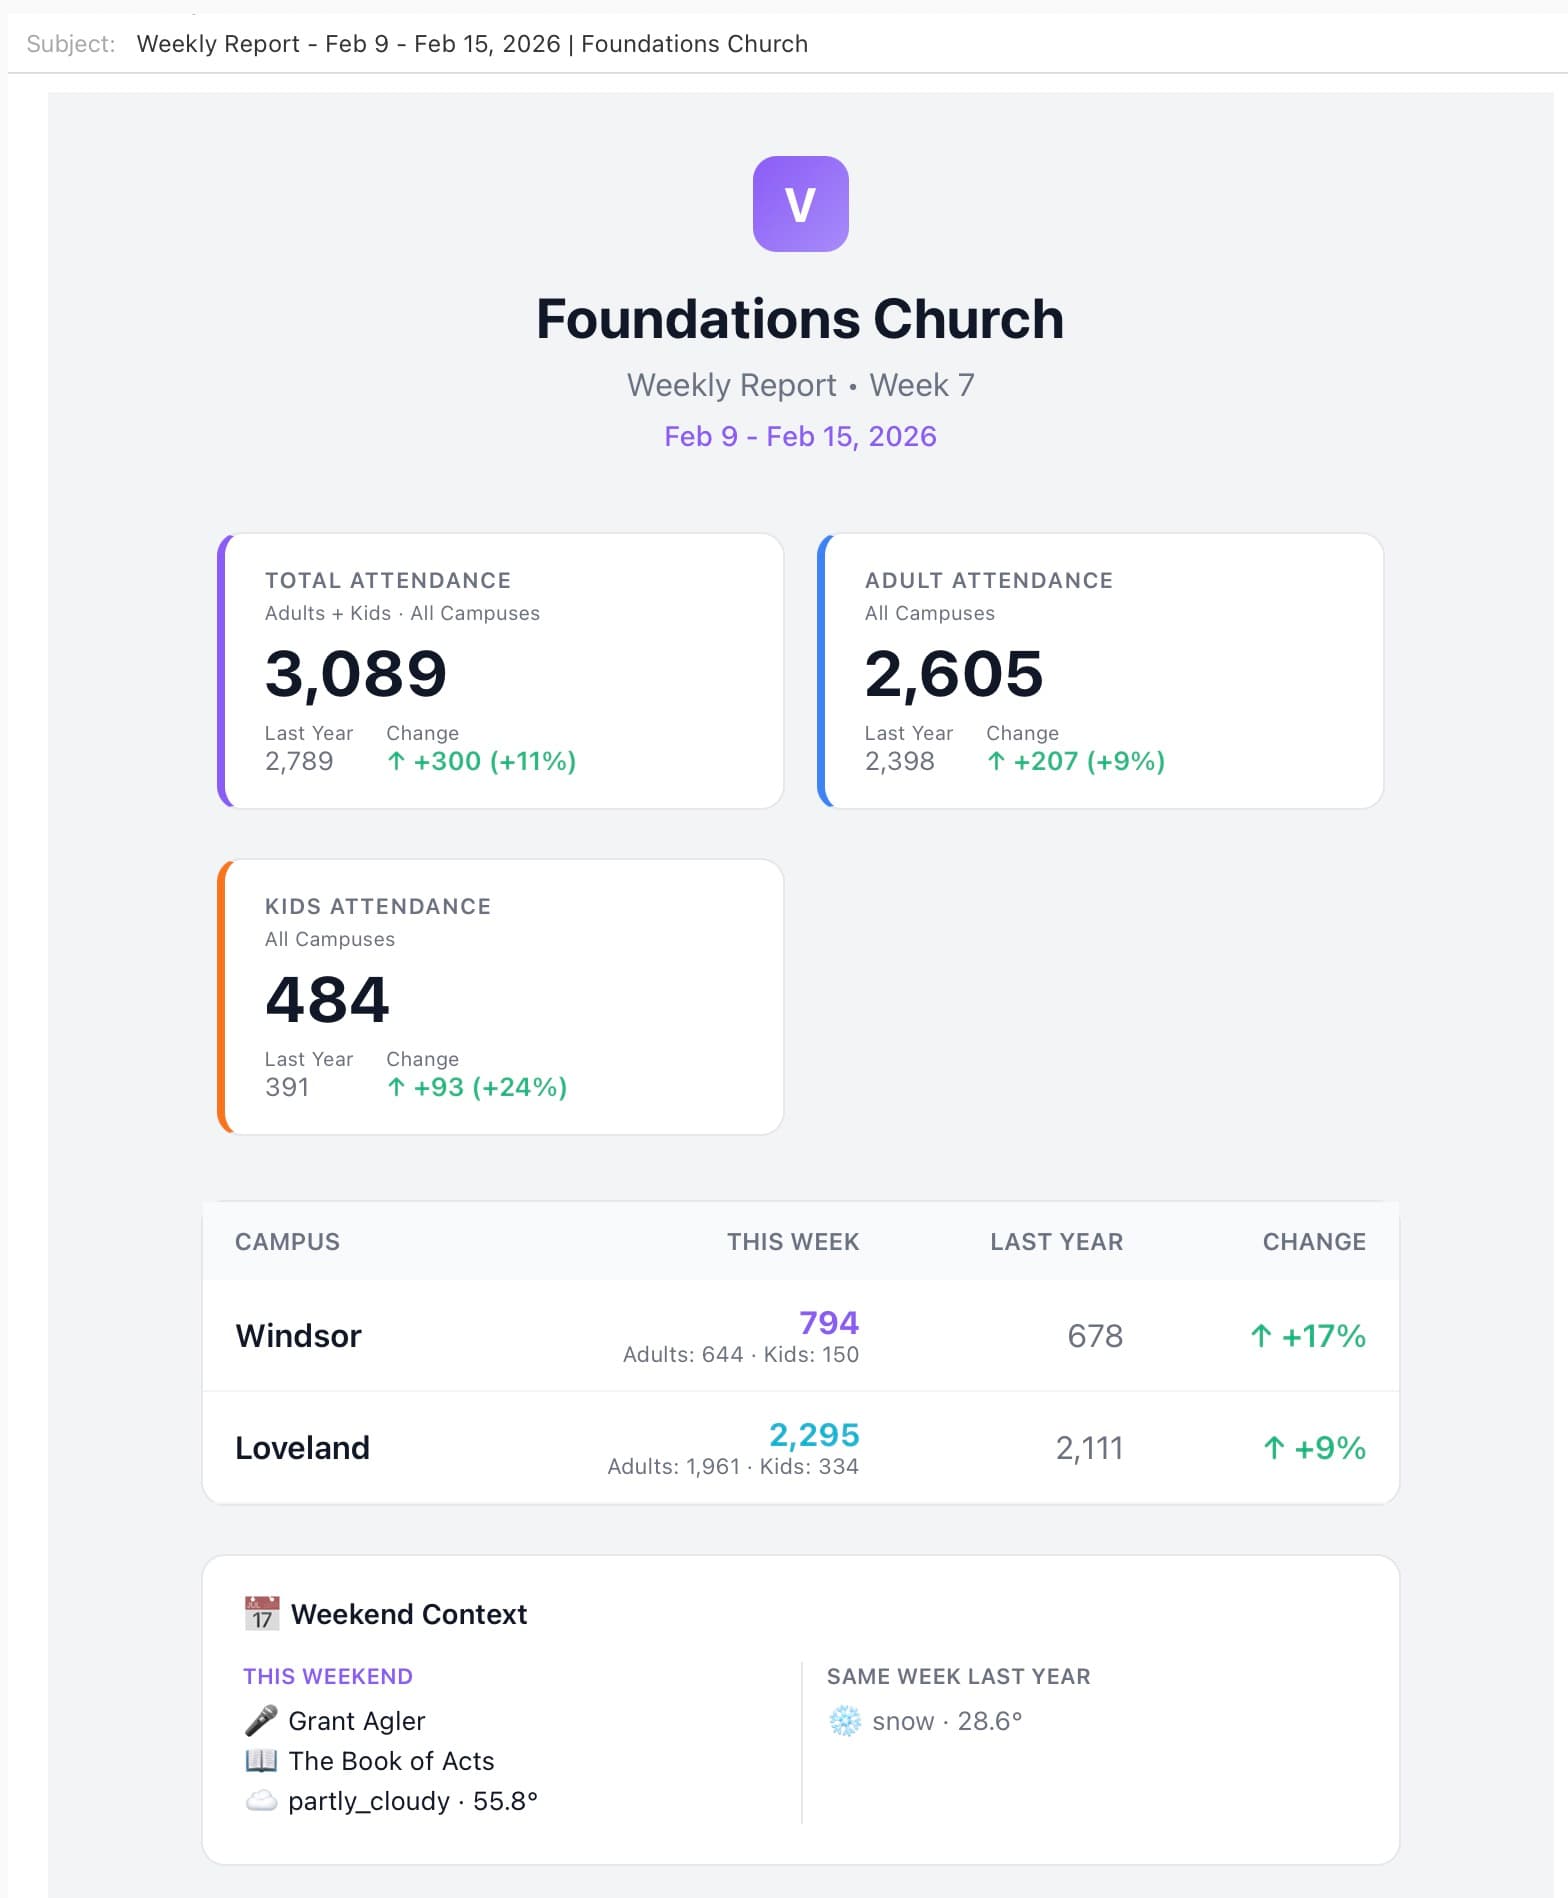
- Email Reports — Beautiful weekly summaries with attendance, giving, year-over-year comparisons, and weekend context — delivered to every leader's inbox
- Slack Integration — Auto-post reports to your team's Slack channel. Campus breakdowns, student stats, giving — all formatted and ready
- Weekly & Monthly — Choose your cadence. Weekly reports land Monday morning. Monthly summaries at the start of each month
- Year-Over-Year Context — Every report includes last year's numbers, weather, speaker, and sermon series so you always know the "why" behind the data
7 Dashboard Views for Every Ministry
Each ministry gets its own focused view. See what matters most, without the noise.
Weekend
Kids
Students
Groups
Giving
Digital
Insights
Next Steps
Baptisms, salvations, dedications, and any custom spiritual milestone you want to track.
Campaigns
Track giving campaigns, outreach events, and special initiatives with dedicated metrics.
Custom Metrics
Our flexible metric cards, graphs, and charts handle most churches out of the box. Need something unique? Custom dashboard metrics built for your church — one-time $250.
Connect What You Already Use
Native integrations that sync automatically. No manual data entry required.
Planning Center
Native Integration
Automatically sync check-in data, giving, and groups. Your data flows in weekly without lifting a finger.
- Check-Ins attendance
- Giving & donations
- Groups participation
YouTube
Track views, watch time, and engagement for online services.
Analytics
Website traffic and online engagement alongside other metrics.
Page reach, post engagement, and follower growth from your church page.
Track reels, stories, and engagement for your church's Instagram account.
More integrations coming — CCB, Breeze, Pushpay, and more.
Safe, Secure, and Built for Trust
Your church data deserves enterprise-grade protection.
Bank-Level Encryption
256-bit SSL encryption protects all data in transit and at rest.
Regular Backups
Automatic daily backups ensure your data is never lost.
Role-Based Access
Control exactly who sees what with granular permissions.
Your Data, Always
Export anytime. Your data is never held hostage.
We Set Everything Up for You
No DIY headaches. Our team personally builds your dashboards and imports your data so you can focus on ministry.
Data Import
Have historical data in spreadsheets, Planning Center, or another system? We'll import it all for you — free.
Dashboard Setup
We'll build your dashboards to match your church — custom metrics, ministry views, and multi-campus layouts.
Integration Setup
Planning Center, YouTube, Google Analytics — we'll connect your tools and make sure data flows automatically.
Just email support@vitals.church with your data and we'll handle the rest.
Simple Pricing. No Surprises.
One price per campus. Unlimited everything else.
Standard License
Per campus location
- Free Dashboard & Data Setup
- Unlimited Users & Data
- Planning Center Integration
- Mobile App & AI Counting
- Giving & Groups Tracking
- YouTube & Social Analytics
- Multi-Campus Support
- Email Reports
- Priority Support
Need a metric we don't have? Custom metrics built for your church — one-time $250.
New Church Plant?
If you are under 2 years old, Vitals is FREE for 1 year.
Vitals was built by pastors, for pastors. If your church would genuinely benefit from Vitals but truly can't afford it, we'll work with you. Reach out to us.
Ready to see your church's vital signs?
Join hundreds of churches using Vitals to make better decisions, faster. Start your free trial today—no credit card required.